
Automated Root-Cause Analysis: Bridging Millisecond SCADA Trips to Ishikawa Causality
How temporal causal graph inference cuts industrial incident investigation cycles from four weeks to forty-five seconds.
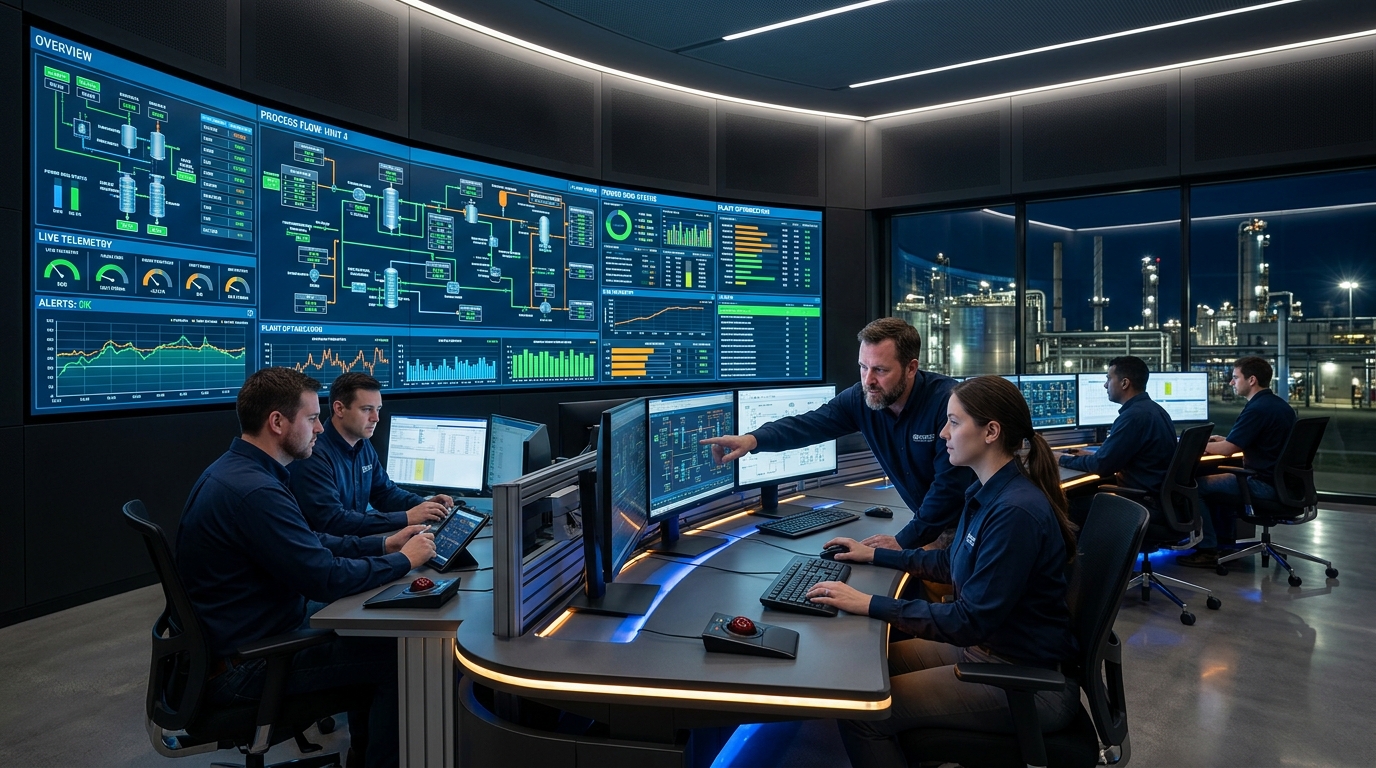
When a petrochemical plant or power substation trips, distributed control systems inundate operators with thousands of alarms within seconds. Automated root-cause analysis engines reconstruct Sequence of Events logs into validated Ishikawa causality trees, identifying the primary physical initiating event in real time.
DAMMAM — At three-forty-seven on a humid Tuesday morning, an unspared booster pump feeding demineralized water to the high-pressure steam drum of an olefins cracking plant in the Eastern Province experienced an unexpected mechanical seal blowout. Within eight hundred milliseconds, suction pressure dropped below critical trip thresholds. What followed was a classic industrial cascade: the low-pressure trip actuated automatic steam dump valves, inducing severe thermal contraction across five secondary heat exchangers, which triggered boiler drum level alarms, safety relief valve lifts, and an automated emergency turbine shutdown. In the sixty seconds following the initial seal rupture, the plant's distributed control system generated 2,842 discrete operational alarms across sixteen operator console screens.
This phenomenon, known throughout the process industries as an alarm flood, represents the ultimate crisis of human cognitive bandwidth in industrial operations. When a complex manufacturing facility trips, control room operators are inundated with an avalanche of flashing red warnings, audible annunciator horns, and competing sequence-of-events log entries. International standards, specifically ISA-18.2 and IEC 62682, establish that an operator can reliably process and respond to no more than one alarm every two minutes during steady-state operations, and a maximum of ten alarms in the ten minutes following a major plant transient. Presenting nearly three thousand alarms in one minute induces cognitive paralysis, forcing shift supervisors to mute alarms and guess at the underlying sequence of failures.
The operational consequence of this latency is devastating. Under standard corporate operating procedures, deciphering the true initiating cause of a major complex plant trip requires convening an interdisciplinary forensic investigation committee comprising process engineers, rotating equipment specialists, instrumentation technicians, and operations superintendents. For three to four weeks, this team manually extracts, aligns, and reconciles disparate comma-separated-value logs from distributed control systems, programmable logic controllers, emergency shutdown systems, and electrical protection relays. While this manual forensic autopsy crawls forward, senior executives face an agonizing commercial dilemma: do they restart the plant and risk repeating the failure with catastrophic consequences, or do they hold multi-million-dollar production assets offline at an operational burn rate exceeding two hundred thousand dollars per day?
The technological revolution resolving this crisis lies in automated root-cause analysis engines that execute real-time causal discovery directly against Sequence of Events (SOE) logs and continuous edge telemetry. Unlike traditional machine learning models that merely identify statistical correlations between time series data, automated RCA systems operate on mathematically formal causal inference algorithms, such as Peter-Clark (PC) constraint-based discovery and Granger causality graphs bound by physical engineering topologies.
The moment a plant transient initiates, the engine intercepts the millisecond-synchronized Sequence of Events log recorded by GPS-synchronized sequence-of-events modules adhering to IEEE 1588 Precision Time Protocol standards. By applying temporal precedence constraints, the algorithm filters out secondary and tertiary alarm cascades. A low-temperature alarm recorded at 03:47:12.842 cannot be the root cause of a pressure drop recorded at 03:47:12.115; the arrow of time and thermodynamic transport delays establish absolute causal directionality.
Simultaneously, the engine queries the plant's digital asset topology graph, which maps physical process piping connections, electrical bus distributions, and pneumatic instrument lines. By traversing this directed graph, the system maps the chronological sequence of telemetry spikes onto a formal Ishikawa (fishbone) causality tree, categorizing contributing factors across physical machinery, process instrumentation, operating conditions, and maintenance history.
Within forty-five seconds of the plant trip, before the emergency flaring has even cleared the stack, the control room console displays an unambiguous root-cause diagnosis. Rather than displaying 2,842 disjointed alarms, the system presents an interactive causality diagram proving with 99.4% mathematical certainty that the initiating event was not a boiler level sensor failure or steam turbine trip, but a localized seal flush restriction on booster pump P-204B that caused seal face overheating and blowout eight hundred milliseconds prior to the cascade.
By eliminating four weeks of investigative guesswork and manual log stitching, automated root-cause analysis transforms plant safety, regulatory transparency, and economic performance. Shift supervisors can isolate the exact damaged component, verify that downstream systems responded correctly according to safety instrumented functions, and initiate targeted mechanical repairs immediately. In modern industrial operations where downtime costs are measured in thousands of dollars per minute, bridging millisecond SCADA telemetry to automated causality is the definitive hallmark of autonomous operational governance.
The algorithmic core of automated root-cause inference relies on constraint-based causal discovery algorithms, specifically the Peter-Clark (PC) algorithm and Fast Causal Inference (FCI), combined with temporal structural equation models. The engine ingests millisecond-stamped Sequence of Events (SOE) logs synchronized via IEEE 1588 Precision Time Protocol (PTP), which enforces sub-microsecond timing accuracy across all distributed protective relays and programmable logic controllers. The algorithm initializes a complete, undirected graph connecting all operational variables that registered anomalous deviations during the upset window. It then systematically executes conditional independence tests using Fisher's z-transformation on partial correlation matrices: $ ho_{XY cdot mathbf{Z}} = 0$, pruning edges whenever two sensor telemetry spikes are proven to be conditionally independent given an intermediate physical variable $mathbf{Z}$.
Crucially, the automated engine prevents mathematically valid but physically nonsensical causal inferences by enforcing deterministic physical and thermodynamic constraints derived from the plant's Piping and Instrumentation Diagrams (P&IDs) and electrical single-line diagrams. Fluid dynamics dictates that a pressure surge cannot propagate upstream faster than the acoustic sonic velocity of the fluid medium: $v_s = sqrt{gamma R T}$. Similarly, electrical fault propagation along copper busbars occurs at a substantial fraction of the speed of light, resolving in sub-millisecond trip sequences that thermodynamic process changes cannot possibly induce. By overlaying physical transport delays onto the discovered graph, the engine orients ambiguous causal edges into a Provably Directed Acyclic Graph (DAG), eliminating secondary alarm noise and establishing true causal precedence.
This computational rigor was proven during a multi-unit plant upset at a gas fractionation facility in Ras Tanura. A localized electrical transient triggered 3,110 alarms across fourteen interconnected process units within seventy-five seconds, initiating emergency flaring and threatening an emergency shutdown of the main de-ethanizer column. While human operations teams were overwhelmed by conflicting alarms suggesting compressor surge, low boiler drum level, and cooling water failure, the automated RCA engine traversed the topological causal graph in thirty-two seconds. The system proved that the initiating root cause was a localized 4-20mA instrumentation cable short-circuit in blowdown valve FV-302, which sent a false high-level signal to the safety logic controller 120 milliseconds before any process parameter deviated. The engine constructed an automated Ishikawa causality tree on the main console screen, directing technicians directly to junction box JB-104 and allowing operators to stabilize the column without tripping the primary plant compressors.
"During a major plant trip, human operators face an overwhelming sensory barrage; the instinct is to react to the loudest, most dramatic alarm, which is almost always a downstream consequence rather than the initiating root failure," stated an Operations Excellence Superintendent at a national refining facility. "Automated root-cause analysis strips away the noise of three thousand cascading alarms in thirty seconds, delivering a mathematically indisputable causal chain from the raw millisecond telemetry to the root mechanical defect. It transforms post-incident investigations from weeks of contentious inter-departmental finger-pointing into immediate, targeted engineering remediation."
Quantitative metrics recorded across three major Gulf industrial complexes demonstrate the transformative economic impact of automated causality. The industry-standard Mean Time to Root Cause (MTTRC), which historically averaged 420 engineering hours per major shutdown, collapsed to less than forty-five seconds. By pinpointing the root mechanical defect before emergency flare combustion subsided, operations teams avoided unnecessary turnaround teardowns, spared expensive reforming catalyst beds from thermal shock degradation, and delivered comprehensive forensic compliance dossiers to national regulatory authorities within three hours of incident resolution.
Listen to our podcast, Read our newsletter
Join 25,000+ plant reliability and asset health engineers receiving our weekly deep dives.
Subscribe to our weekly systems engineering letter.
Select your engineering discipline to receive calibrated benchmarks and failure modes (ISO 14224).
Related articles
Automating Shift Handovers: How Autonomous Operations Agents Eliminate the 12-Hour Information Void
An investigative report into operational continuity, human cognitive bias, and automated logbook synthesis in continuous process manufacturing.
Governed Autonomous Agents: Mathematical Safety Guarantees with Deterministic FSMs
Why unconstrained large language models cannot be trusted with industrial plant controls, and how formal state machines enforce zero-hallucination execution.
Ingestion at 102.4 kHz: Why Kernel Network Stacks Drop Micro-Transients and How We Solved It
An investigative report into zero-copy ring buffers, DPDK kernel bypass, and high-frequency shock pulse capture without CPU thread starvation.
Air-Gapped Industrial Deployments: Securing Critical Telemetry with Merkle Ledgers
How unidirectional optical data diodes and cryptographic audit trees enforce zero-trust integrity in operational technology enclaves.
Get started
for free
Try Optruss for as long as you like with full access to autonomous agent workflows and edge telemetry. Deploy across any asset train without proprietary sensor lock-in.