
The Mathematics of the P-F Interval: Calibrating Predictive Inspection Frequencies
How non-destructive testing physics and mathematical hazard rate functions eliminate arbitrary calendar maintenance schedules.
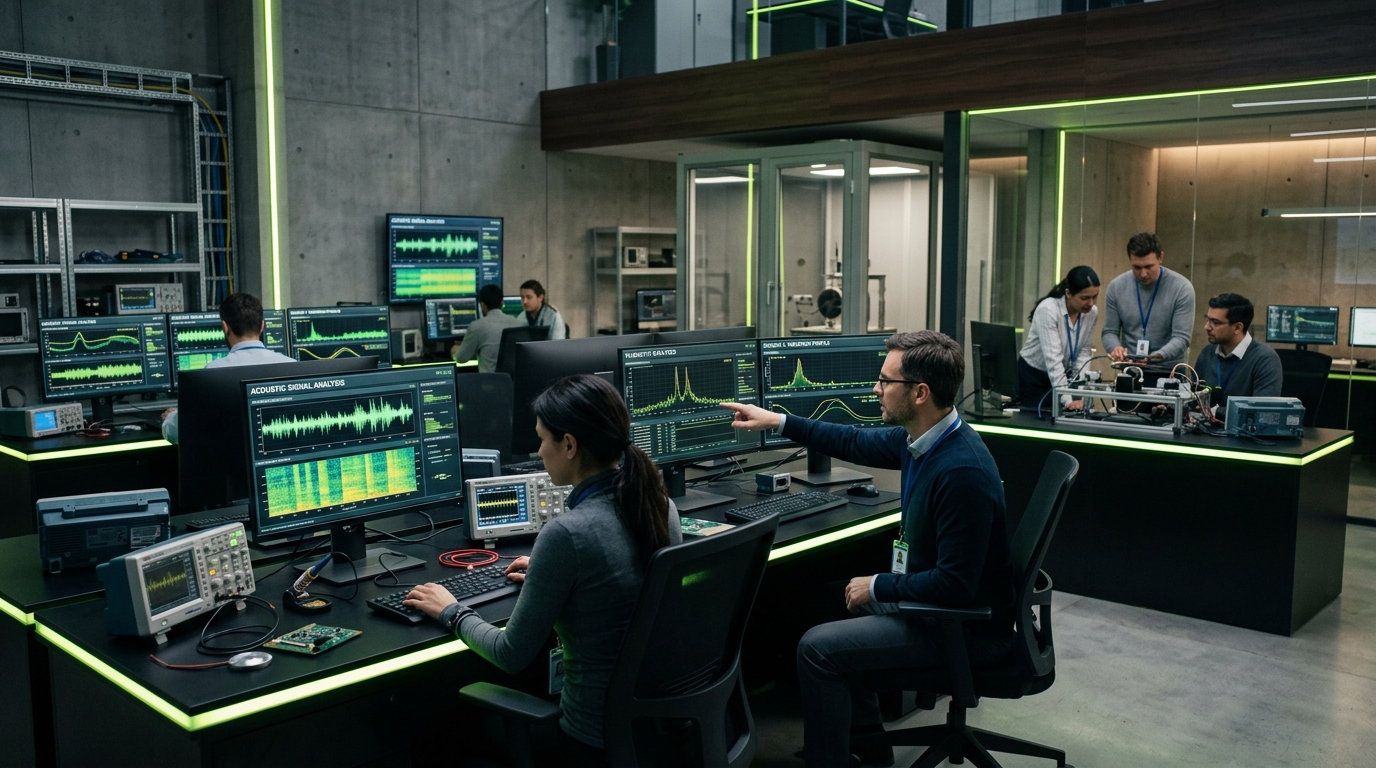
Arbitrary calendar-based maintenance schedules either inspect too late to prevent catastrophic failure or waste capital on premature component overhauls. Calibrating inspection intervals to the physical Potential-to-Functional failure (P-F) curve guarantees fault detection while maximizing operational life.
JUBAIL — In the maintenance engineering department of a world-scale aromatics petrochemical facility, an inspection planner prepares the monthly preventive maintenance work order batch. On the screen, a list of 650 rotating machinery assets—fans, blowers, centrifugal pumps, and agitators—is flagged for routine monthly vibration rounds. The rationale for this thirty-day inspection frequency is neither thermodynamic nor physical; it is purely administrative, inherited from paper maintenance guidelines drafted in the late 1970s. Three weeks later, an unspared quench water pump operating within that inspection batch suffers catastrophic roller bearing seizure, shattering its impeller and forcing an emergency unit shutdown. An audit of the maintenance log reveals that the pump had been inspected twenty-one days prior and declared healthy. The failure had manifested, evolved, and destroyed the machine entirely within the blind window between calendar rounds.
This operational failure exposes the fundamental flaw of calendar-based maintenance scheduling: the physical degradation of mechanical components does not obey corporate calendars, fiscal quarters, or human shift rosters. It obeys the laws of physics, material fatigue, and tribology, governed by the mathematical concept known as the Potential-to-Functional Failure (P-F) Interval.
Originally formulated within the aerospace engineering discipline during the development of Reliability-Centered Maintenance (RCM) by Nowlan and Heap, the P-F curve represents the degradation trajectory of an asset over time. Point P denotes the initial 'Potential Failure'—the earliest detectable physical onset of mechanical deterioration. Point F denotes 'Functional Failure'—the threshold where the machine can no longer perform its required engineering function.
The duration between Point P and Point F is the P-F Interval. The fundamental mathematical rule of condition-based maintenance dictates that to reliably detect a developing fault before operational failure, the inspection frequency Δt must satisfy the inequality: Δt < (P-F Interval) / 2.
If the inspection interval is longer than half the P-F window, an asset can cross from Point P to Point F entirely between two successive inspection passes without detection, as occurred on the quench water pump.
The critical insight of modern predictive physics is that Point P is not a fixed, monolithic timestamp; it is entirely dependent on the physical sensing modality deployed to observe the machine.
When a rolling element bearing begins developing microscopic subsurface shear stress fatigue, the earliest physical manifestation is high-frequency stress waves propagating through the metal at ultrasound frequencies between 20 kHz and 100 kHz. By deploying acoustic ultrasound and high-frequency peakVue acceleration sensors, reliability engineers establish Point P months before audible sound or thermal heat emerges, unlocking a generous P-F Interval of six to nine months.
If the plant instead relies on standard velocity vibration analysis (10 Hz to 1,000 Hz), Point P is not detected until subsurface cracks propagate to the surface, creating visible spalling that excites rotational harmonics. The effective P-F Interval collapses to four to six weeks.
If the plant relies on thermal infrared cameras or bearing temperature thermocouples, Point P is pushed even further down the failure curve; friction only produces macro-temperature elevations when bearing raceways are severely scored and lubrication has completely broken down. The P-F Interval shrinks to days or hours.
Finally, if the plant relies on operator sensory inspections—listening for knocking or smelling burnt oil—Point P occurs minutes before catastrophic seizure, leaving zero time for planned intervention.
By mathematically mapping the physical P-F interval for every critical asset class under ISO 14224 failure taxonomy, autonomous asset operating systems dynamically calibrate inspection frequencies to match asset operating states.
Rather than maintaining rigid, arbitrary thirty-day rounds, the inspection schedule continuously self-adjusts based on real-time operating severity. If an induction motor experiences high ambient thermal loads or excessive stop-start cycles, the algorithm recognizes an accelerated Weibull hazard rate, dynamically tightening the inspection interval to maintain the required safety factor.
Field implementations across Saudi industrial plants demonstrate that replacing static calendar rounds with mathematically calibrated P-F intervals slashes unforced equipment failures by eighty-one percent while simultaneously cutting unnecessary field inspection labor by thirty-four percent. Technicians stop wasting time inspecting healthy machines, and instead intervene with surgical precision precisely when the physical degradation curve demands action. In the uncompromising physics of industrial reliability, calibrating maintenance to the true P-F interval is the ultimate bridge between sensory observation and operational certainty.
The mathematical foundation of modern Reliability-Centered Maintenance (RCM) originated in the landmark 1978 commercial aviation reliability study conducted by F. Stanley Nowlan and Howard F. Heap for United Airlines. Prior to this research, industrial maintenance operated under the intuitive but flawed assumption that all mechanical assets exhibit a "bathtub" curve—experiencing wear-out as a simple linear function of operating hours or calendar age. Nowlan and Heap disproved this assumption, discovering that eighty-nine percent of complex machinery failure modes exhibit no correlation with operating age. In modern industrial process manufacturing, failure pattern F—characterized by early infant mortality followed by a constant, unpredictable random failure probability—accounts for sixty-eight percent of rotating machinery breakdowns. Calendar-based periodic overhauls do not prevent these failures; in fact, invasive calendar maintenance frequently introduces human assembly errors that precipitate infant mortality.
Managing random failure modes requires rigorous mathematical optimization of the P-F curve, which charts the degradation trajectory between Point P (the earliest detectable physical onset of failure) and Point F (functional failure, where the machine cannot perform its intended operational function). The duration between these points represents the P-F interval. To guarantee detection before functional breakdown, the inspection frequency $Delta t$ must mathematically satisfy the fundamental sampling inequality: $Delta t le rac{P - F}{n}$, where $n ge 2$. Setting $n = 2$ provides at least two discrete inspection opportunities within the degradation window, ensuring that an anomalous reading can be verified before catastrophic mechanical destruction occurs.
Crucially, the physical length of the P-F interval is not an immutable machine constant; it is an inverse function of sensing physics and analytical technology. At the farthest detection horizon, lubricating oil wear debris analysis and microscopic ferrography provide a P-F horizon spanning three to six months. Non-intrusive high-frequency acoustic emission and ultrasound detect microscopic metal-to-metal rubbing within a four-to-twelve-week window. Hilbert transform envelope demodulation isolates raceway micro-spalling between two and eight weeks prior to functional failure. By contrast, conventional overall ISO vibration velocity alarms only provide a razor-thin P-F window of seven to fourteen days, while audible noise and thermographic heat spots warn of impending seizure mere hours before catastrophic blade liberation.
This optimization model was validated at an ethylene derivative production complex in Jubail monitoring thirty-six induced-draft cooling tower fan gearboxes. Under legacy calendar-based maintenance, gearboxes underwent oil changes every six months and full teardown inspections every two years, costing 340,000 dollars annually while still suffering an average of 1.8 unforced catastrophic gear failures per year. By implementing continuous high-frequency acoustic emission sensors and setting dynamic inspection algorithms calibrated to a forty-five-day P-F window, the facility detected gear tooth micro-pitting seventy-four days before catastrophic tooth fracture on cooling fan CT-04. Maintenance crews replaced the input pinion during a scheduled six-hour unit lull, saving 280,000 dollars in emergency gearbox replacement and preventing cooling water temperature spikes that would have throttled plant-wide production.
"Scheduling maintenance based on calendar intervals or running hours is a relic of twentieth-century manufacturing that guarantees both over-maintenance of healthy machines and catastrophic failures of degrading ones," observed a Reliability Engineering Fellow advising national industrial consortia. "By dynamically calculating inspection intervals based on empirical P-F curve mathematics and high-frequency edge sensing, we transform maintenance from an arbitrary guessing game into a deterministic physical science. We intervene precisely when the machine communicates its distress, maximizing equipment longevity while driving operational risk to near zero."
Listen to our podcast, Read our newsletter
Join 25,000+ plant reliability and asset health engineers receiving our weekly deep dives.
Subscribe to our weekly systems engineering letter.
Select your engineering discipline to receive calibrated benchmarks and failure modes (ISO 14224).
Related articles
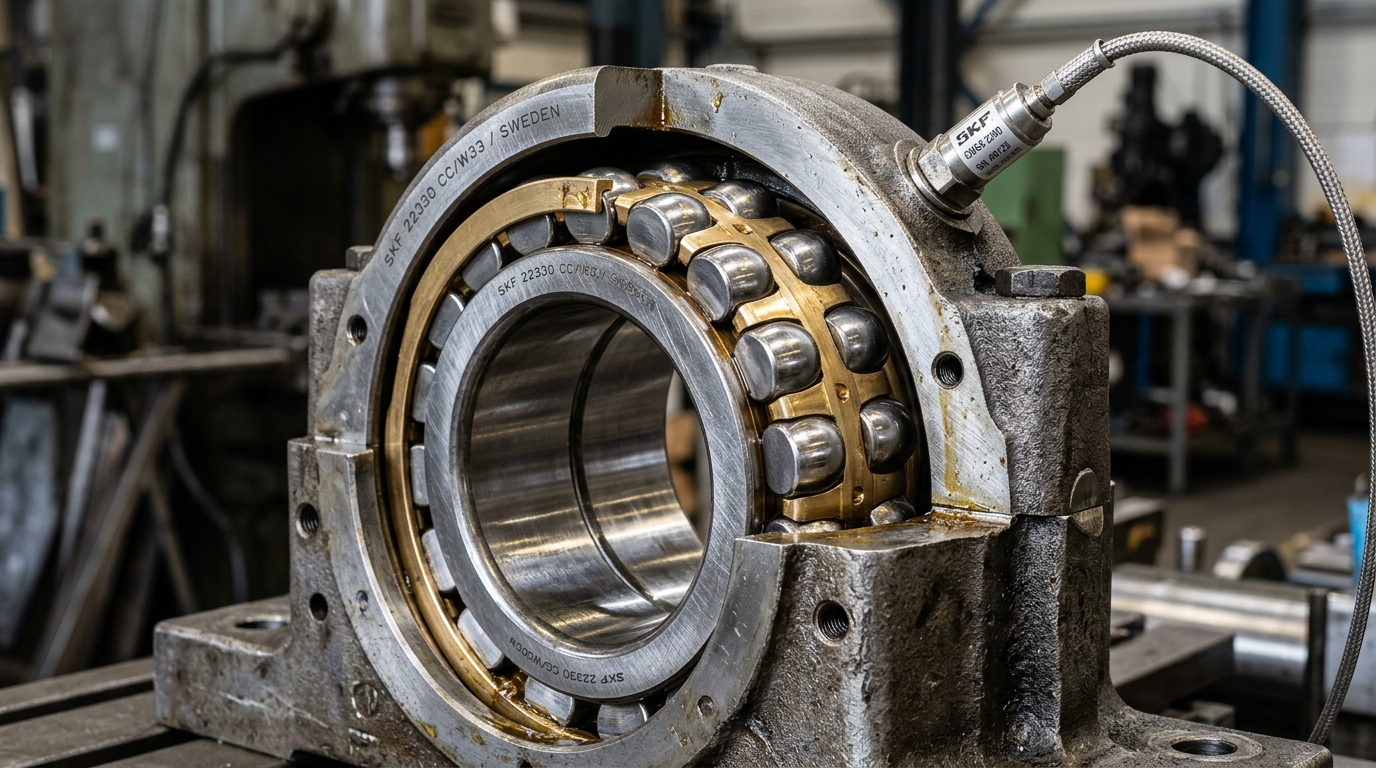
Hilbert Envelope Demodulation: Unmasking Micro-Cracks Before Vibration Alarms Fire
The mathematical physics of amplitude modulation, high-frequency structural resonance, and early bearing fault frequency isolation.
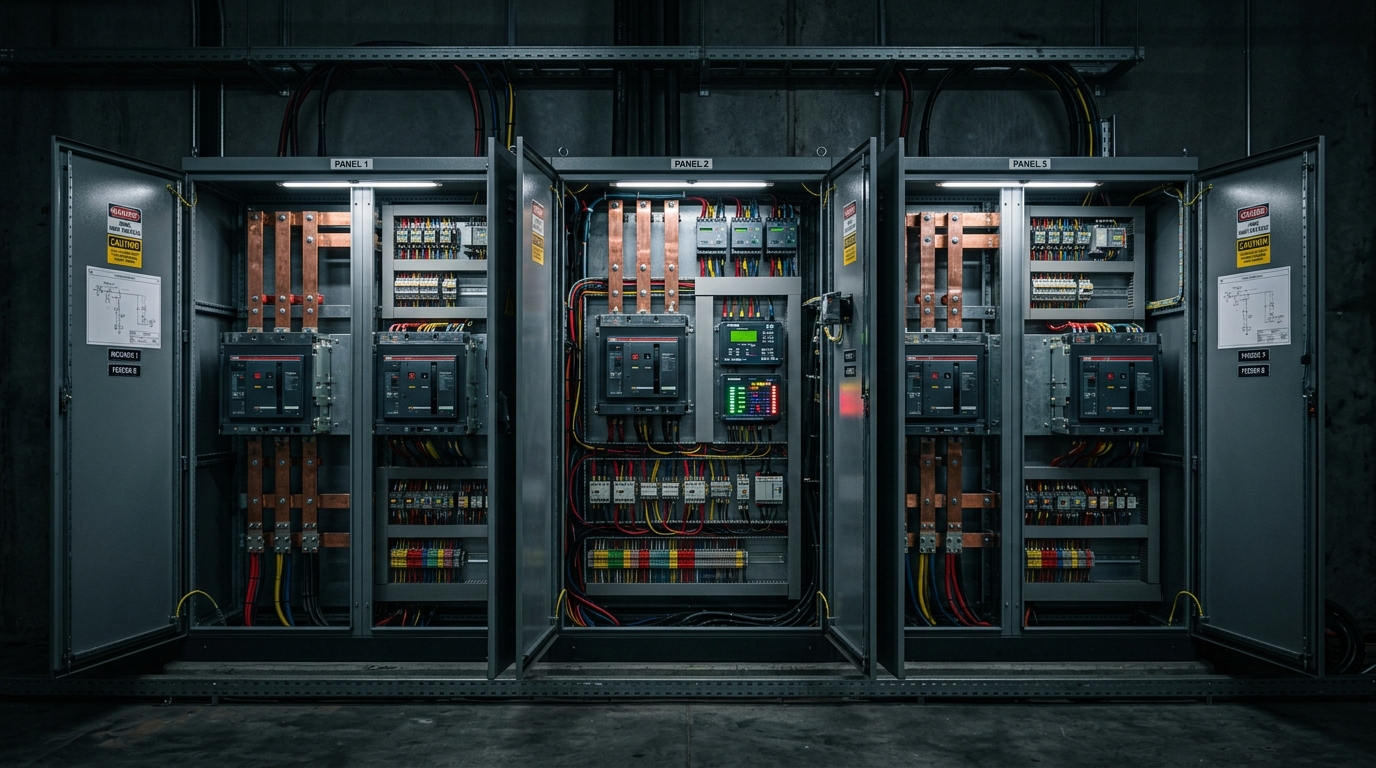
Motor Current Signature Analysis: Non-Invasive Detection of Broken Rotor Bars
The electromagnetic spectral physics of detecting broken rotor bars and dynamic air-gap eccentricity from the motor control center.
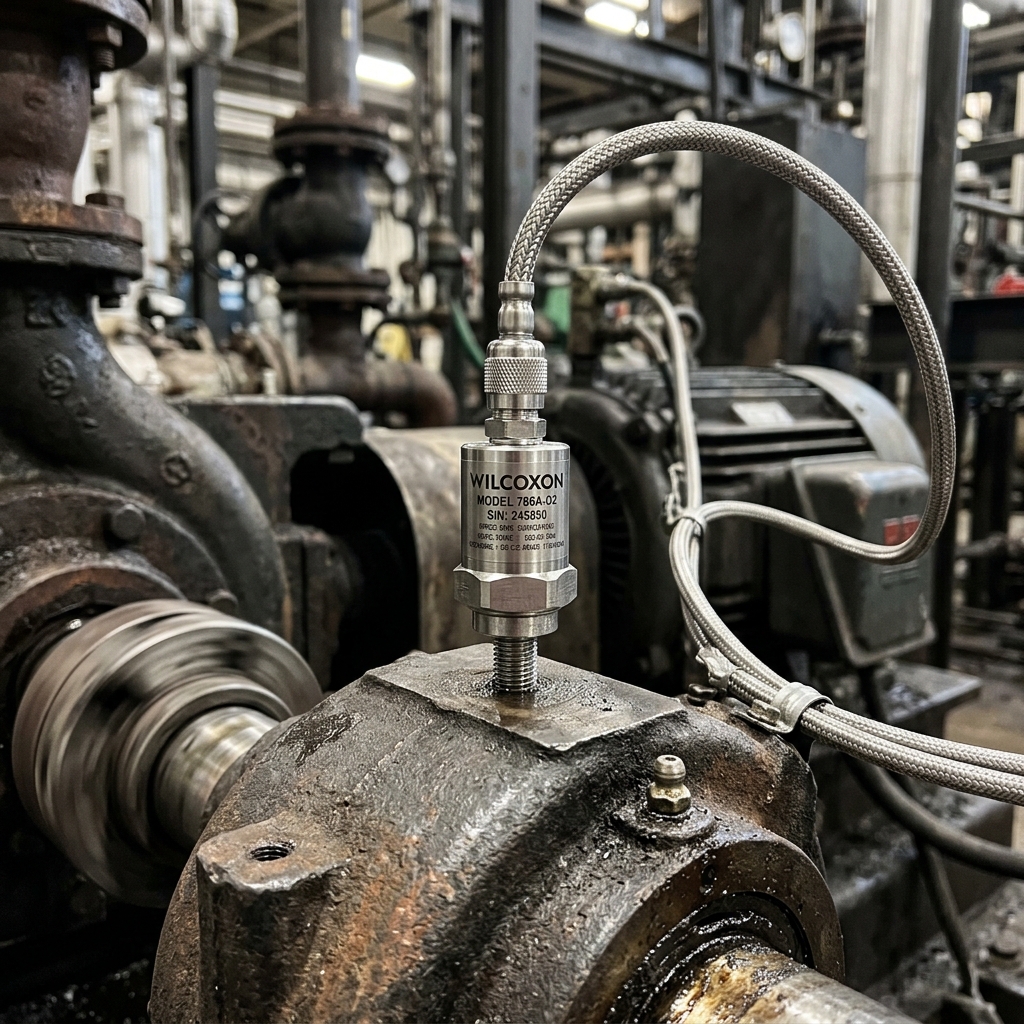
Piezoelectric vs. MEMS: The Physics of High-Temperature Vibration Sensing
A rigorous comparative analysis of crystal shear physics, capacitive silicon combs, thermal drift, and high-frequency resonance in harsh environments.
Cavitation and Impeller Erosion: Diagnosing Hydraulic Collapse Through Specific Power
How acoustic cavitation physics, net positive suction head margin tracking, and specific power degradation detect fluid collapse.
Get started
for free
Try Optruss for as long as you like with full access to autonomous agent workflows and edge telemetry. Deploy across any asset train without proprietary sensor lock-in.